 Looking for more shares for your content, links to your site and more attention to the information you are sharing? Looking for some information how to make an infographic ?
Infographics are a visual way of representing your data.
It is not suitable for all data but for the data that it is suited to it gets a lot more attention than just text.
If you promote the infographic to other relevant sites they may also publish it and this leads to more attention and links.
We recently got an infographic produced with the guys at Socially Sorted.
They did an excellent job and it was well worth the money. But you may not always have the budget to do an infographic. So there are some tools that can help.
Here is the infographic we professionally produced that got shared like crazy.
In this article, we discuss how to make an infographic using 5 different tools:
1. How to make an infographic using Piktochart
Cost: It is free to use with 7 free infographic templates but you’ll have Piktochart branding which is not suitable for most businesses. The paid solution starts at $29 and with this you have over 129 different themes to choose from.
This review is based on the $29 paid version.
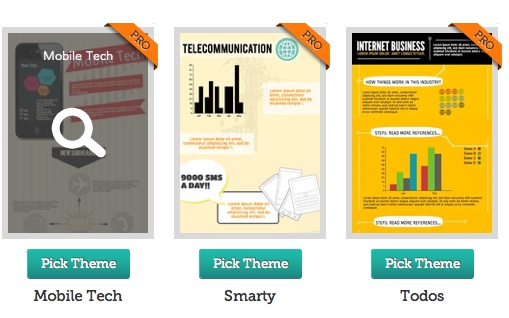
When you login to Piktochart you will be impressed with the variety of infographics templates that are available and the quality of them.
The themes are broken down into categories so you can view a filtered list depending on the category you are interested in.
When you select a theme you are brought to the main editing screen. You can also start with a blank canvas so you can build your theme from the ground up.
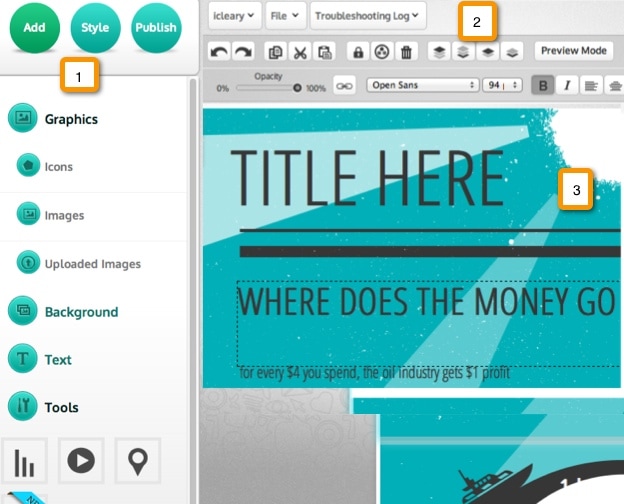
The options listed above are:
1. Move between the different menu options. In this example, we have selected the Add menu, which enables you to add extra text, images, buttons, and more to your infographic (over 2,000 available). For example, you might want to add your logo.
If you select Style you can select from a variety of styles which will change the background color schemes used for the infographic.
Click Publish when you are ready to launch the infographic.

2. Additional editing options for the currently selected item in the infographic. For example, you can flip elements vertically or horizontally, change the order of the layers (bring them to the front or push them to the back), group elements together, and so on.
3. This is the main editing window. Just click on the text to modify it, change images, update the layout, etc.
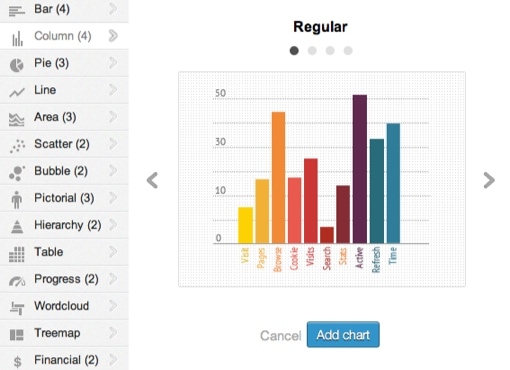
Based on the template above I started creating a cool infographic. I deleted some elements, changed background colors and then added a new graph in.
The graph functionality is really good, there is a wide variety of graphs to choose from and you can have one up and running quite quickly.

It takes a little while to get used to the user interface but once you are familiar with it, you can start creating really good infographics.
Feature Highlights
- Great option for graphs
- Ability to add video to the chart
- Wide variety of standard images to add to your infographic
- Ability to apply different color palates to the standard templates (or to your own blank canvas)
- Good publishing options – PNG, JPG, and HTML or publish directly to social media channels.
Areas to improve
Continue to make the user interface easier to use but overall Piktochart provides some great functionality and works really well.
Overall Opinion
Piktochart is an infographic creator that provides a great selection of professional templates with good editing options for your infographic. Overall I think that $29 per month is really good value for money.
2. Infogr.am
Cost: There is a free version but you only have the option to download it as a PNG. The option for downloading as a PDF is only available with the paid version, which is $18 per month. With the paid version, you also get some extra themes to choose from.
For this review I used the paid version of Infogra.am.
When you first login you can select from 10 different infographics templates. All the templates have a very similar style but just slightly different layouts and colors so you have a very limited choice.
Unfortunately, there is no option to start from a blank canvas either, which you might want to do sometimes.
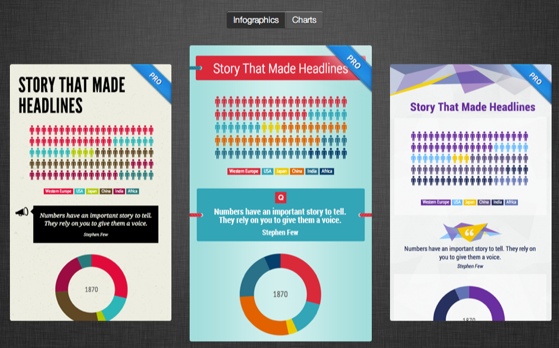
You will see they provide the option to switch between building infographics and charts (top of the image above). There are 14 different chart styles with each style having a few types. You can download the charts as PNG’s or PDF’s.
When you select your template you are then brought to the area for editing your infographic.
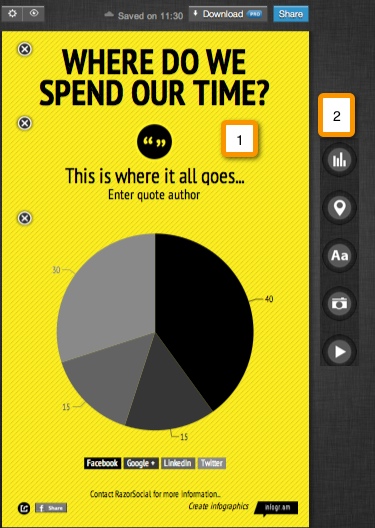
1. This is where you can edit the text. It’s easy to click any item and update the text.
2. This is where you can add text, graphs, a map, pictures or videos to your infographic.
Unfortunately, there is no library of images to choose from.
Feature Highlights
- Very simple tool to use and low in price.
- Good options for building graphs which can be part of (or separate to) the infographic. The only issue is that separate charts have Infogr.am branding even with the paid version.
Areas to improve
- A library of standard images to add to your infographic is really essential
- Need to provide a wider range of templates to choose from
- Removing the Infogr.am branding from the chart option
- Need an option to start with a blank canvas
Overall opinion
If you want a simple infographic that is very similar in look to the template provided you can have it up and running quickly. However, for the majority of cases you will want more editing options, more templates to choose from and the ability to create one from the ground up.
3. Easel.ly
Cost: Free.
When you register with Easel.ly you can either select a blank canvas to create your infographics templates from scratch or choose from the 15 templates that are made available. To select a template you just drag it onto your canvas area.
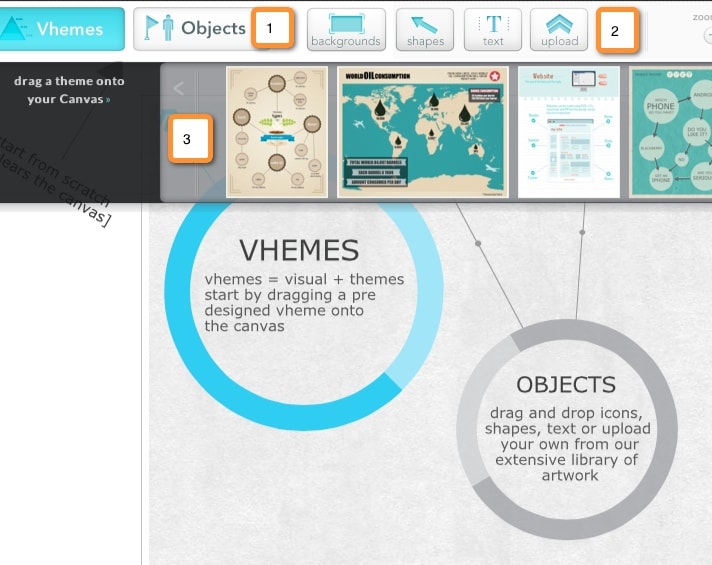
1. Objects – These are a suite of categorized images that you can select from to include in your infographic. In total there are about 100 images including animals, banner images, transport images, people, landmarks, etc.
2. Additional configuration options to do things like change the background color or add shapes and text.
3. These are 15 templates to choose from. When you want to apply a template you just drag it onto the canvas area.
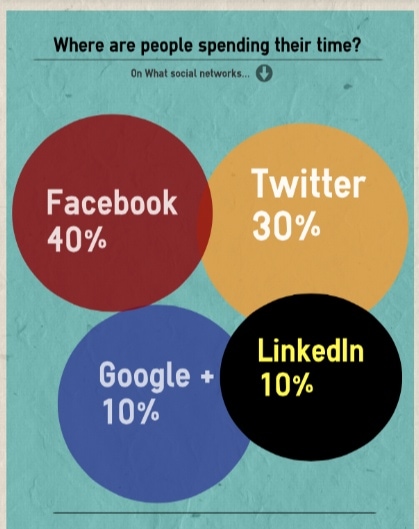
The following graphic took me only a couple of minutes to create. I selected a template, applied different colors, added text and made my own infographic.
Feature Highlights
- Simple to use, dragging and dropping elements (e.g. background, templates), etc. is a good feature.
- Good variety of images to choose from
- Opacity option which means you can adjust the transparency of any image (darker, lighter, invisible!)
Areas to improve
- There is no option for adding graphs, which are generally a key component of an infographic
- More templates are required
- No option for adding video
- Expand publishing options, currently only available as a JPG.
Overall opinion
Easel.ly is a nice tool that requires more development work. But it has promise. If they expand on the editing options, add graphs and expand on the templates it will be interesting (depending on price).
4. Visual.ly
Cost: Some infographics free but most are custom designs starting at $999.
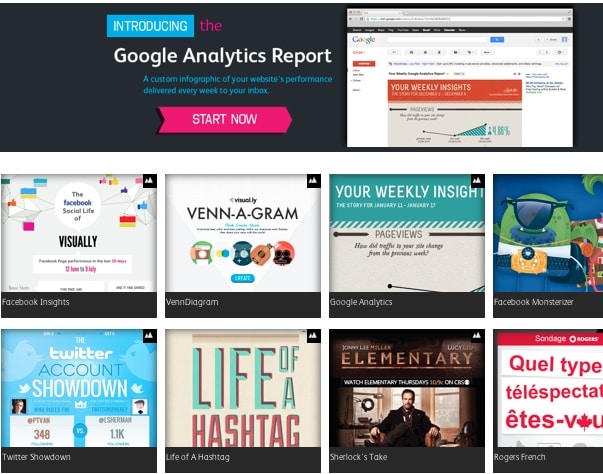
Visual.ly is a place to get your infographic, video, interactive content or online presentation created. When you arrive on the site you can view a display of infographics created by the community.
When you want an infographic created you upload your details to Visual.ly and they source the appropriate team to deliver the infographic.
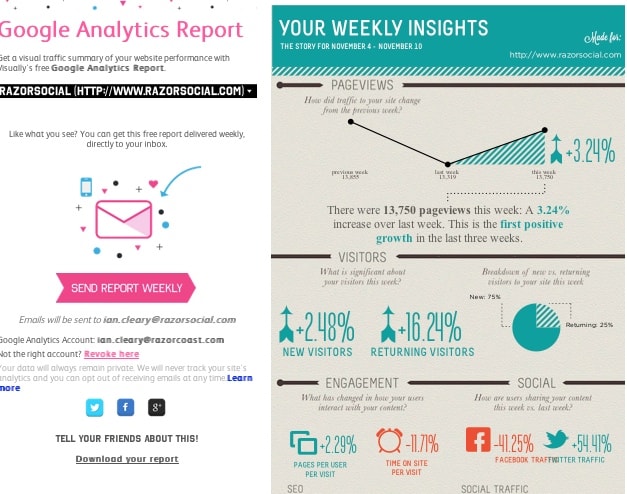
There is an area of Visual.ly that provides you with infographics you can download that are automatically generated from your Google Analytics data or from your social media profiles. There is also a basic venn diagram that you can customize for your own needs.
To access these infographics go to: https://create.visual.ly
Here’s an example of the weekly Google report that you can get which is automatically delivered to you via email.
Feature Highlights
- Useful free infographics for Google Analytics and Social Media Analytics
- If you want custom infographics they have a market place where they source the best talent to help you create it.
Areas to improve
- Ideally they should provide a proper tool for creating and editing your own infographics but as their main income comes from custom designs it’s unlikely they will do this.
Overall opinion
The only customized infographic you can create is for a very basic venn diagram. The remaining infographics are automatically generated based on your Google Analytics or social media data and are really designed to be a lead generation mechanism for Visual.ly.
5. Venngage
Cost: There is a free option but you cannot download the infographic. The paid solution is $19 per month.
Venngage provide social media analytics and infographics software (strange combination!).
When you login there are 30 templates to choose from and then a range of templates available from the marketplace.

When you want to use a template you have to add it to your shopping cart. Although they all appear free at the moment I assume they will add on some paid ones and this charge will be on top of your paid subscription.
The design of the current templates are not great. Other tools have more professional designs.
This is your canvas for designing.

The menu options on the left include:
- Charts – select from a good range of charts and graphs to add to your infographic
- Pictogram – various images to choose from
- Shapes – there are hundreds of shapes available including people, maps, nature, technology, etc.
- Text – add text to the infographic
- Image – add an image from the web or upload your own images
- Background – you have a few options but you do not have the option to enter your own custom colors.
It’s a pity the templates are poor quality as the tool itself is quite easy to use.
Feature Highlights
- Good graph option
- Good variety of images that you can add to your infographic
- Easy to use editing facility
Areas to improve
- There is a public market place where you can share and let other people use your template. This is a good idea but unfortunately the quality of the infographics currently shared are not great.
- More templates are required
- No option for adding in video
Overall opinion
Quite a good editing tool but it’s let down because the templates provided are poor quality.
Summary
Infographics are still a great way of getting attention and getting links back to your site. But unfortunately, they can be expensive to create.
If you want to get an infographic up and running and you don’t have the budget for it then there are some good options for creating your own infographics.
So are you already aware of how to make an infographic? What infographic tools have you used? Would you use any of the above?
Tips on Building an Infographic
Donna from Socially Sorted created a fantastic infographic on how to build infographics! Go to her site and view it now or check it out below!!