 When you look at all your Google Analytics data, does it make your head hurt?
Google Analytics is very useful but it includes an awful lot of information. Whenever you talk to anyone about Analytics, they always feel they should be doing more in this area.
Of course, Google engineers keep on adding functionality so, although it gets more useful, it can also get more complex with regular, new functionality that you need to figure out.
But sometimes less is more!
What I mean is that focussing on a couple of good pieces of information can be more valuable than having a sore head looking at lots of data all the time.
Head Hurting Syndrome (HHS) is a well known condition and it is particularly noticeable when someone is trying to figure out pages and pages of Analytics 🙂

So, instead of contracting this condition, you may instead want to think of ways of reducing the stress and anxiety and aim for an easier life.
Here are some ways to simplify your Google Analytics reporting:
1. Use Quillengage to Simplify the Data
Quillengage is a completely free tool that you connect to your Google Analytics account. It will retrieve all relevant data from Google Analytics, parse it, and present it in an easy-to-understand format.
You get initial statistics showing your overall performance comparing the current week to the previous week.
Next, you get paragraphs of text explaining what has happened over the previous week. So, for example, it will say something similar to the following in your report:
“Your organic traffic went up by 10% last week compared to the previous week and your most popular post was ‘5 Tools to Grow Instagram followers”.
This really helps with HHS (Head Hurt Syndrome) because you don’t have to parse all the data yourself. This is all done automatically by Quillengage.
Here is an example of how a report looks:
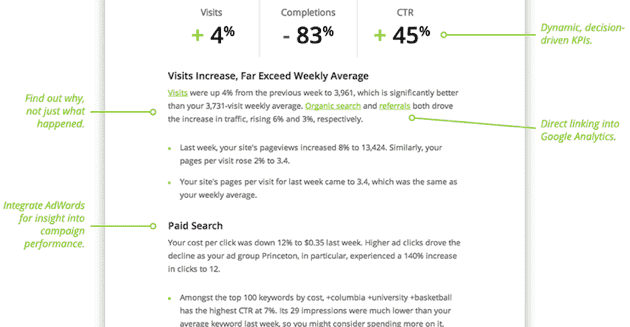
You can see the overall data at the top, followed by text that explains what has happened with your website over the past week.
When you start using Quillengage, you’ll enjoy getting the reports because it gives you very relevant information and it’s as easy to read as an email. Each week, you’ll get a comparison with previous weeks, so you’ll instantly know if you are making progress.
2. Use Google Analytics Summary Reports
If you like looking at data but you want a report emailed to you on a weekly basis, you can set this up in Google Analytics.
As you go through the menu options on the left of the Google Analytics interface, you will see a reporting tab for every page.
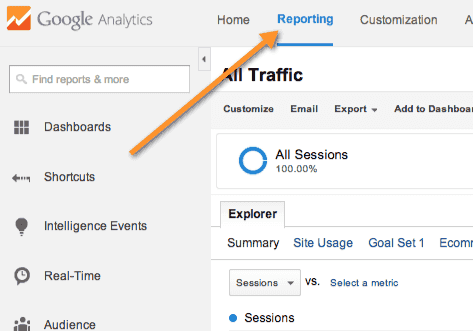
Based on the information displayed on that screen, you can create an e-mail report that is sent to you regularly. To set this up, select the Email option under Reporting.
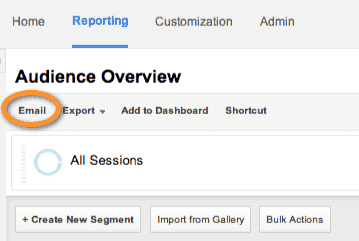
When you select this option, you are presented with the following screen:
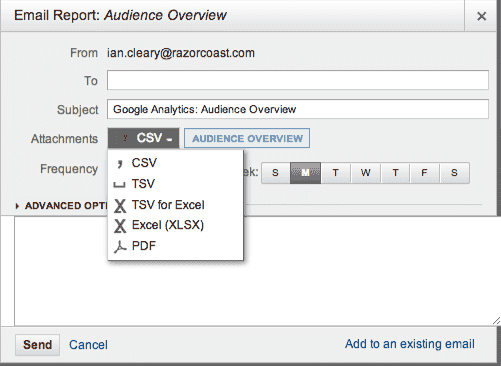
On this screen, you can configure the following:
- Frequency – Do you want it daily, weekly, monthly?
- Format – You may want a CSV (text file with data separated by commas), a PDF, Excel document etc.
- Day of the week – The day of the week it should be sent, assuming you haven’t picked a daily report!
- Recipients – You can specify multiple recipients.
If you are not happy with the standard report on the screen, you can customize the report to suit your needs.
So, consider setting up a PDF report that will give you more visual data than Quillengage provides. Some people like the visual data, and some prefer text!
3. Set up Custom Dashboards
Custom Dashboards in Google Analytics give you a configurable overview of how you are doing for specific areas of Analytics. You can create custom dashboards yourself, or add a custom dashboard made and shared by someone else.
Here is an example of a couple of widgets that are available on a social media dashboard. All of the widgets are about your social media activity. You can have many widgets on a page and you can drag and drop them to reorganize them.
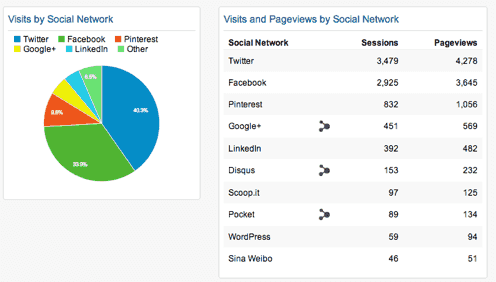
When you want to add a widget you click the ‘add widget’ button and then specify the type of information you want to include.
Here’s an article from Kristi Hynes which explains how to set up a custom dashboard – Click here. And here’s one from Koozai about a range of custom dashboards you can click on and add to your page – Click here.
So, your dashboards can be a good way of providing a nice visual representation of how things are going. You can have multiple dashboards for different areas also (e.g. an SEO dashboard, a social dashboard, etc.). When you log into Google Analytics, it may be the first and only place you need to go.
4. Pick out three stats
If none of the above work for you, just pick one to three statistics that are really important to your business and focus on these.
For example, one of them could be the goals achieved in the current week, compared to previous weeks. If you have set up goals in Google Analytics, and each goal is achieved when a product is purchased, then your most important statistic could be the goals achieved.
If the number of goals achieved is going down, you’ll need to investigate the Analytics in more depth. If it’s going up all the time, maybe you don’t need to.
Of course, you should be looking at Analytics in detail, but if you don’t have time and if you’ve ignored it up to now maybe this will work better for you.
Summary
There is no shortage of Analytics data to look, at but that doesn’t mean to say that you need to look at it all! You are better off simplifying your Analytics reporting and focussing in on the data that really matters.
How do you manage your reporting? Which tools do you use? What data do you monitor?
I’d love to hear from you!
Ian
Analytics image by Shutterstock